Monitor Usage for License Plan
The License Plan screen displays your current license plan, including the type of plan, number of users and items, deployment type, and more.
The data displayed on this screen is specific to your license and varies, sometimes significantly, from one user to another.
Basic License Plan Metrics
For most customers, usage is measured using monthly tracked usage (MTU). Billing is calculated based on the average number of MTUs across the billing period (usually a year). High or low-usage months average out to provide the MTUs tracked for billing purposes.
Your high-level metrics display at the top of the screen:
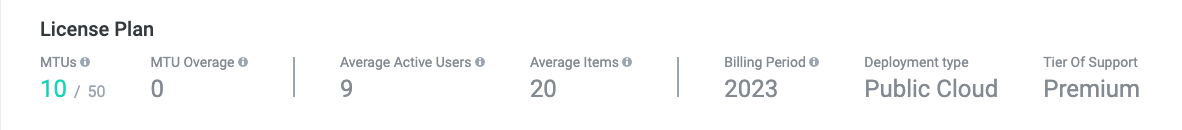
MTU - Monthly tracked usage. MTUs are an entity that calculates usage based on the count of active users per month or the count of items divided by 50—whichever is higher. That is, it operates like a MAX function where
MTUs = MAX({monthly active users}, {monthly active items}/50).For example, for 200 items and 4 users, both counts are the same: 4 MTUs. Conversely, with 200 items and 10 users, the user count is higher, so MTUs = 10.
MTUs are tracked against a preset amount per your license agreement, with 50 MTUs being the minimum.
MTU Overage - The projected overage for the active billing period. MTU overage is a calculation of
MTUs - Licensed MTUs.MTU overages have no immediate or direct financial impact on your subscription. Any overages are included as an additional data point in the renewal conversation to ensure your MTU tier/quota accurately reflects your average usage.
Average Active Users - The average monthly number of users that have actively engaged with your business processes in the current billing period.
Average Items - The average monthly number of items processed in your workflows during the current billing period.
Billing Period - The current billing period per your license agreement.
Deployment type - The type of deployment for your Tonkean instance (that is, public cloud, dedicated cloud, or private cloud).
Tier of Support - The current tier of support for your license.
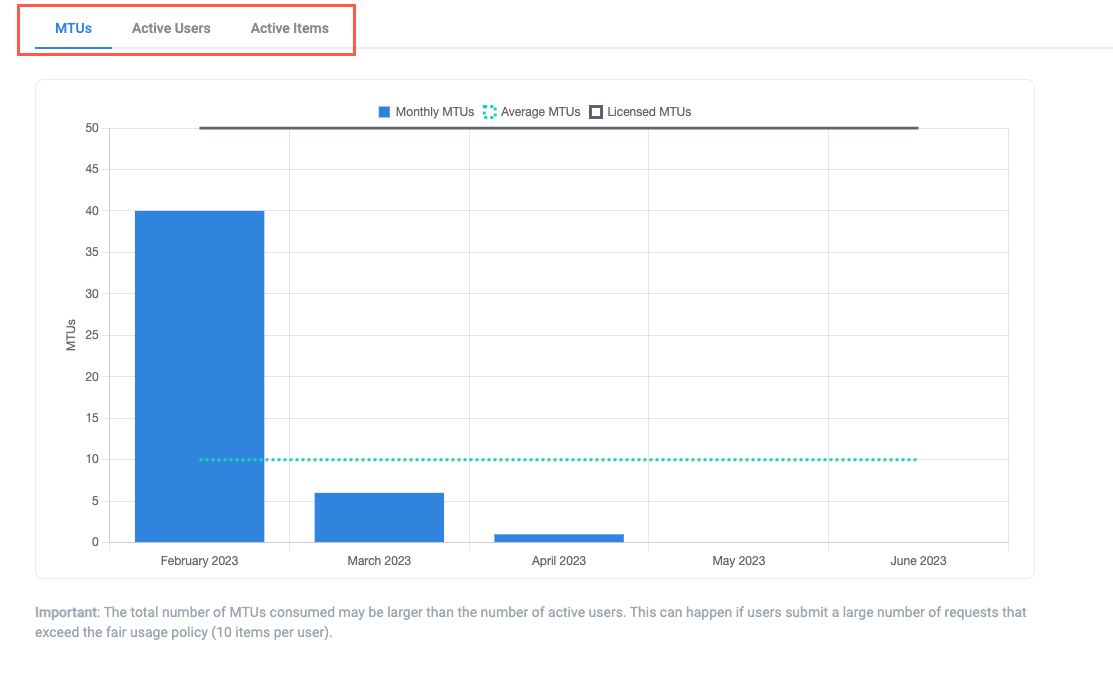
Usage Charts
In addition to the high-level counts at the top of the screen, you can also track your Tonkean usage across time using the charts provided. Select the appropriate tab to view your usage with a focus on different measures. Note that an average count is plotted as a dotted line across available months for all views, allowing you to plan your usage appropriately against your MTU quota.